How can we help?
Search for your question, or browse by topic. If the answer is not here, write to us: that is how this page gets written.
The gestures, on video
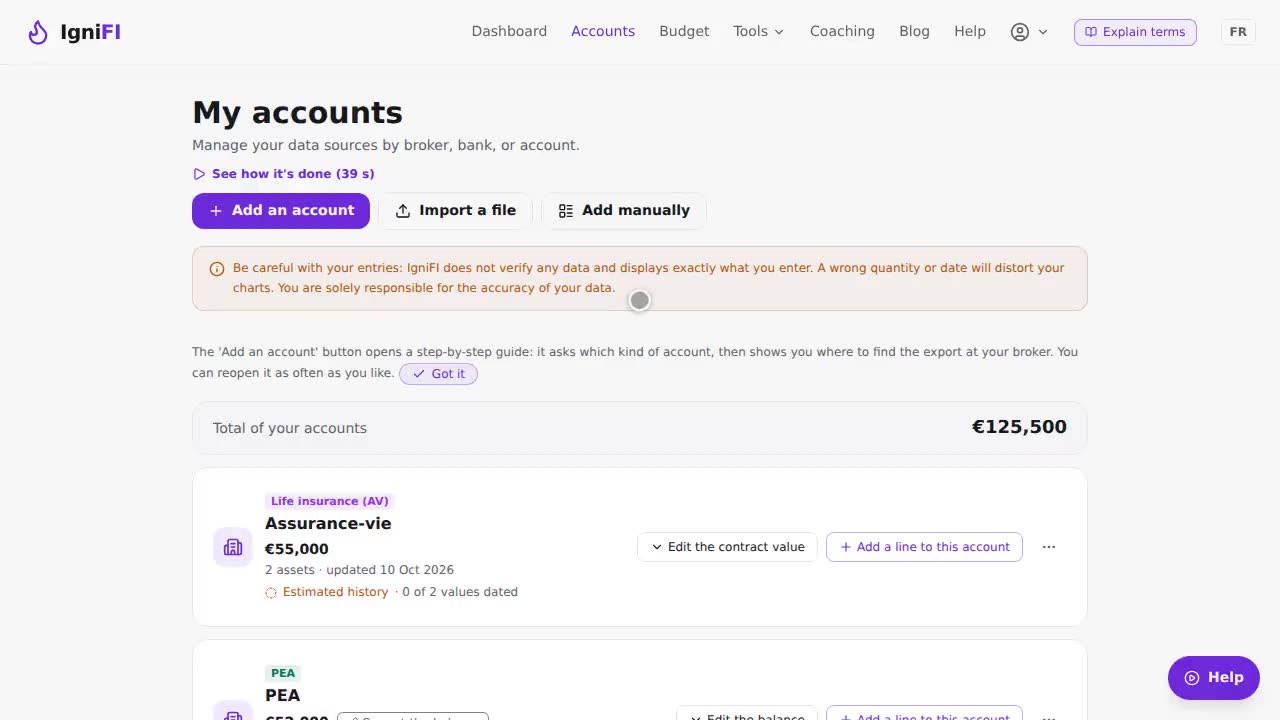
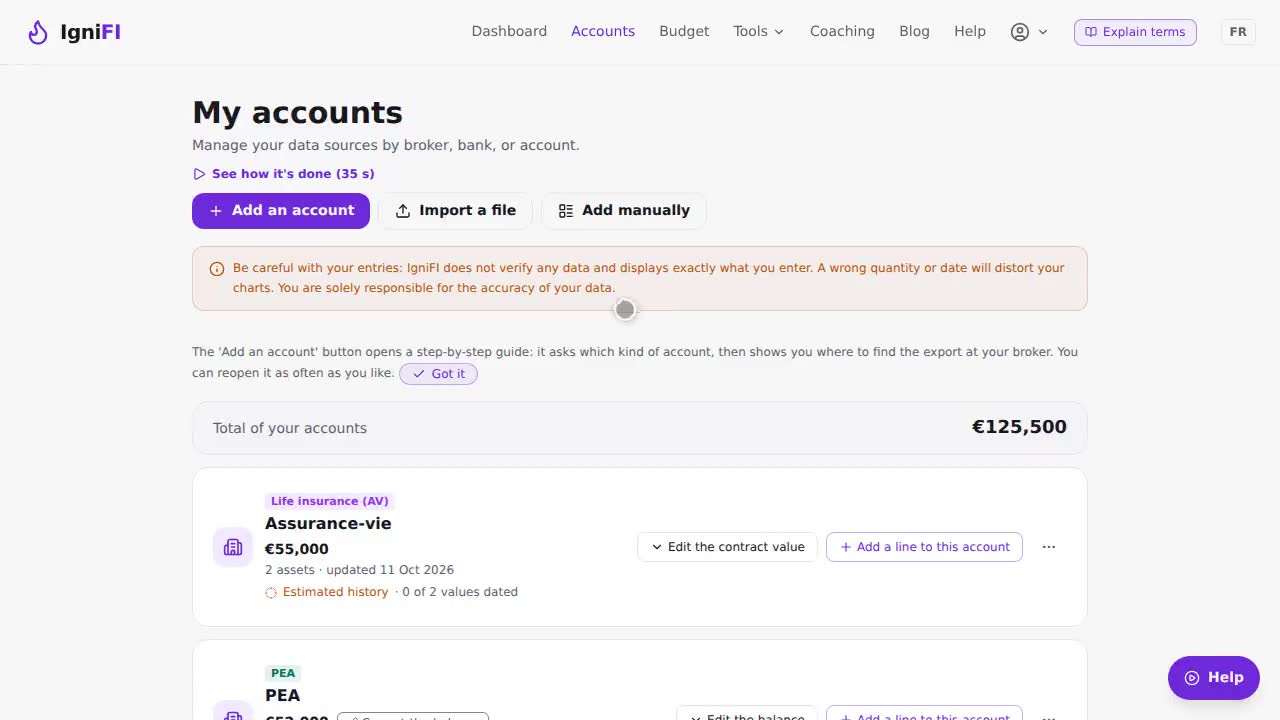
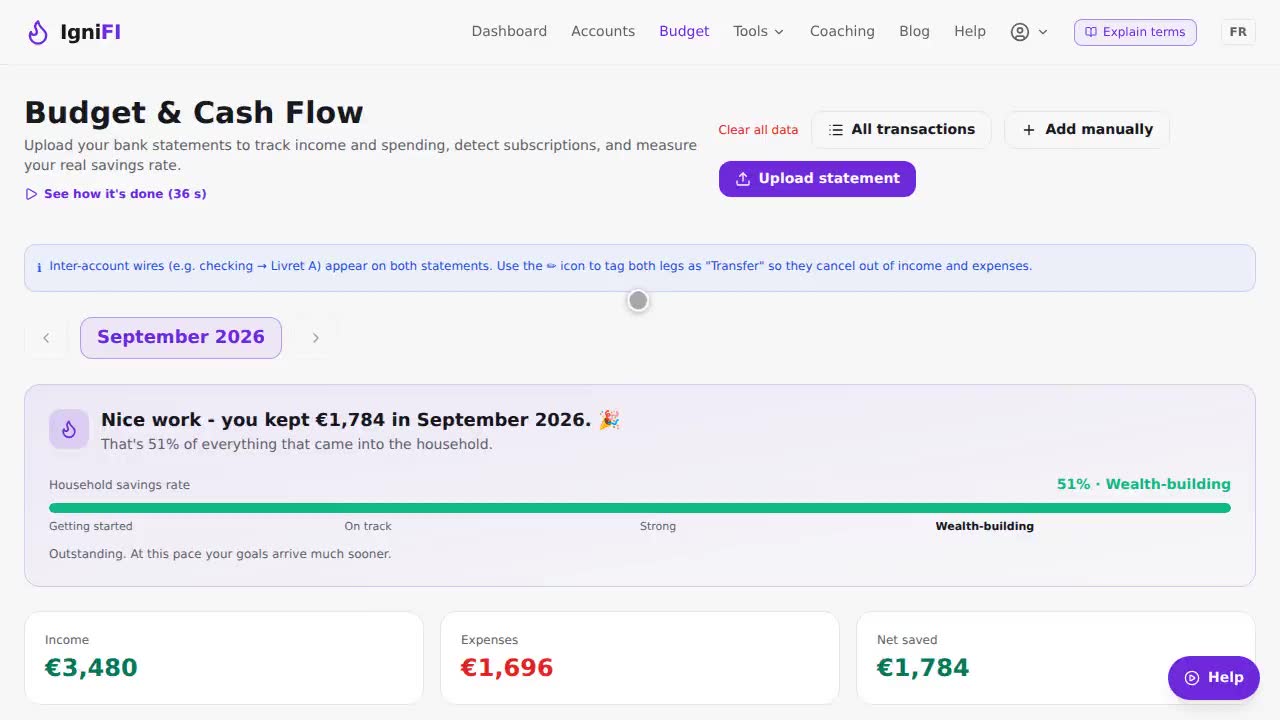
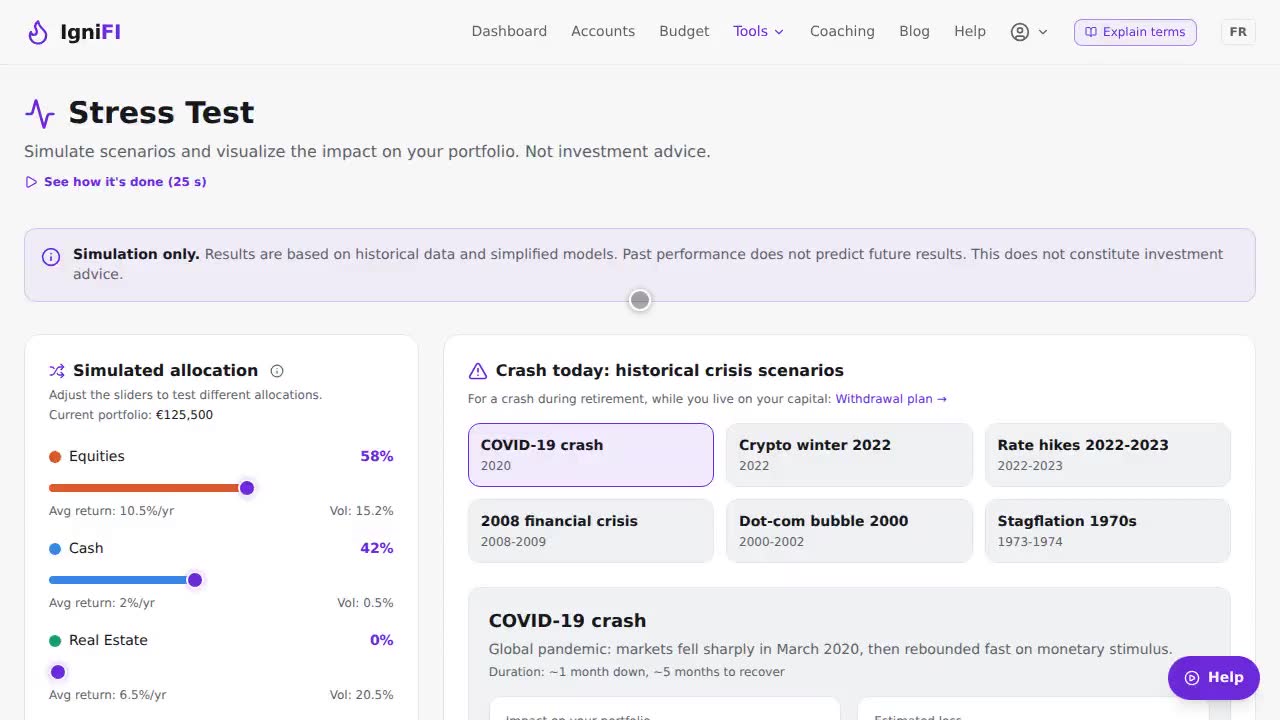
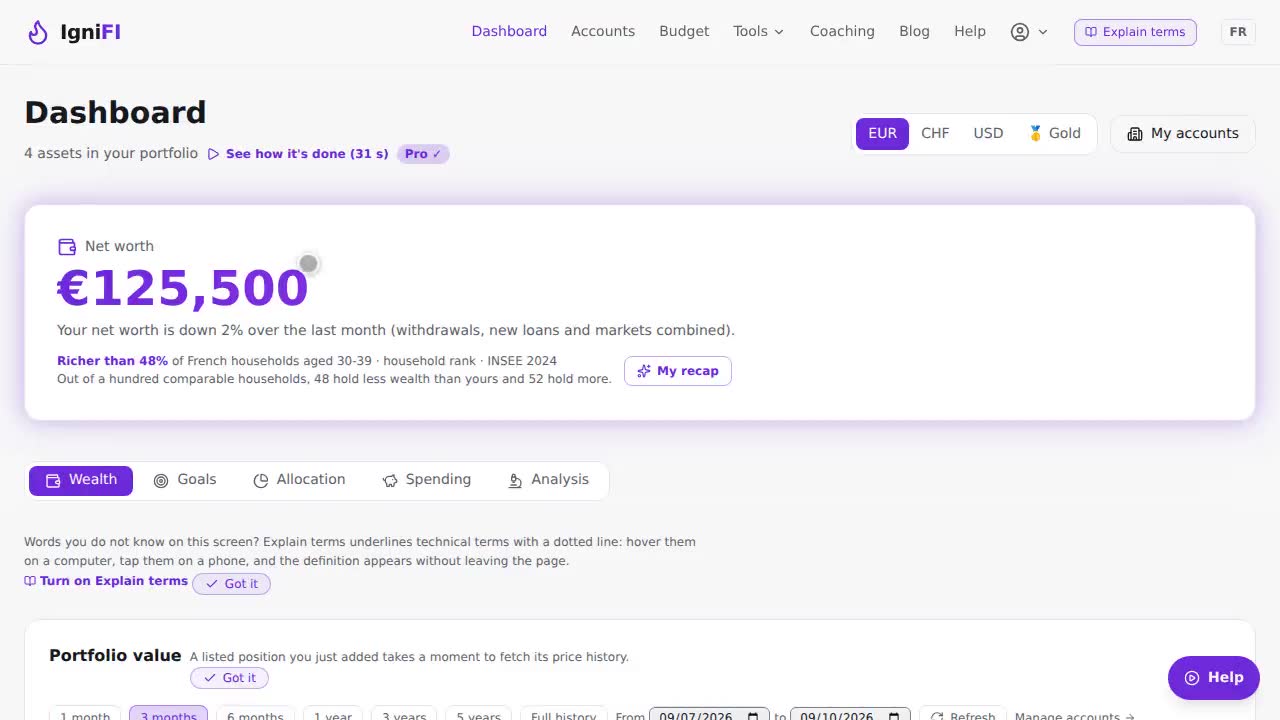
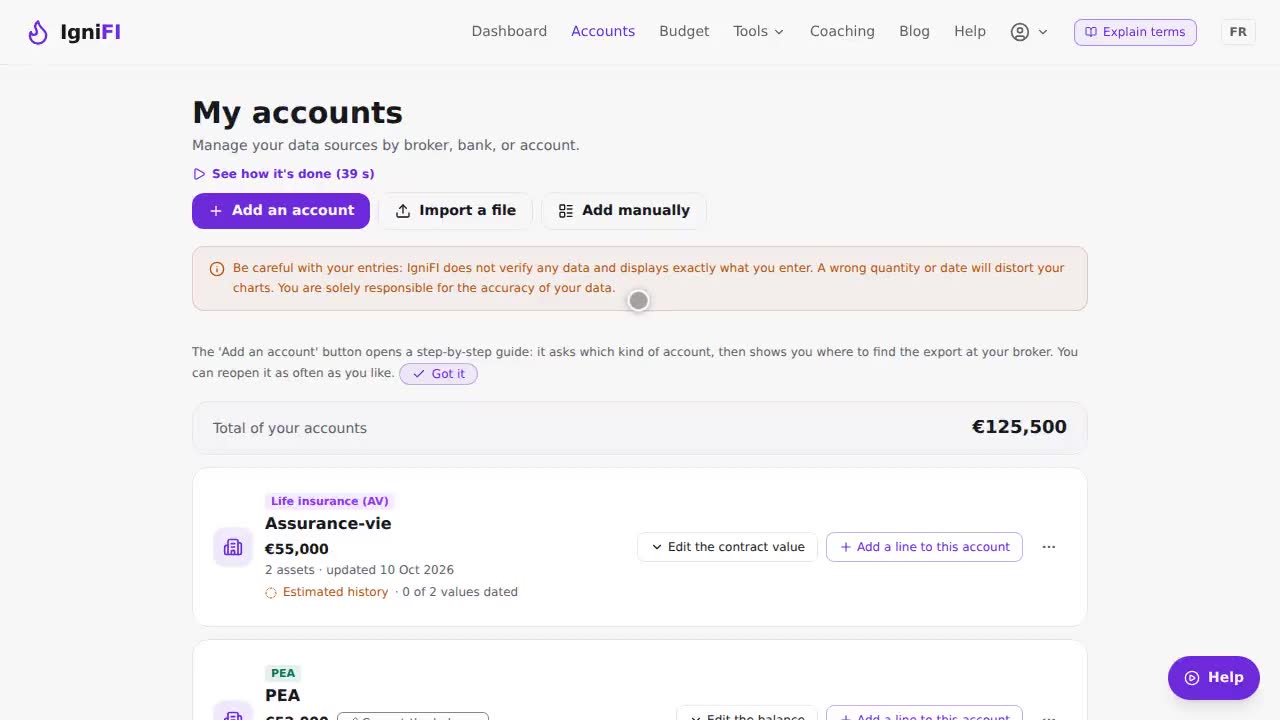
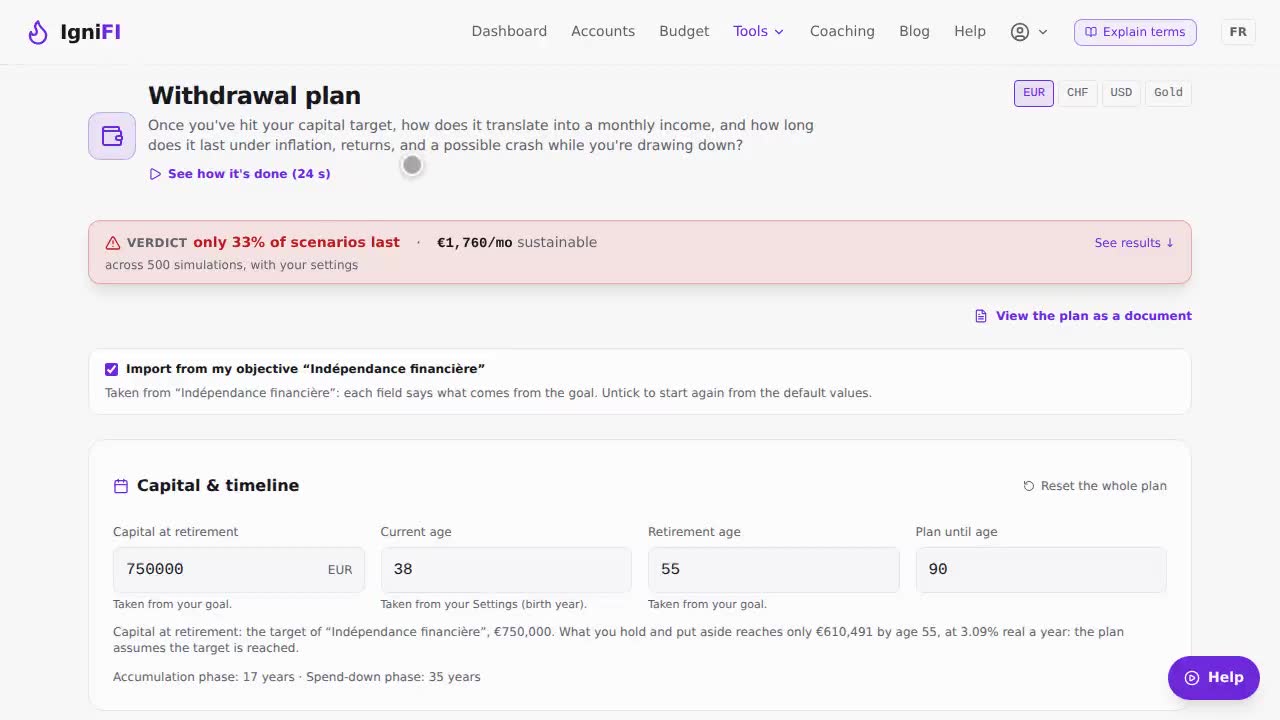
The basic gestures, filmed in IgniFI on an invented household. No sound: each step is written under the picture.
Getting started
Where do I start?
Create an account, then follow the Getting started guide from the My accounts page: IgniFI asks which accounts you hold (share accounts, life insurance, pension wrappers, savings accounts), then what is inside them. Nothing to prepare beyond your latest statements, or simply the amounts off the top of your head.
The first pass is not about being exact to the cent, it is about getting a picture of your net worth. You refine it account by account afterwards.
How long does setting everything up take?
About ten minutes to see your total net worth and your allocation. Longer if you want to rebuild the full history of your buys and sells, but that is not needed to get started and can be done later, one account at a time.
I do not have my history. Can I still start?
Yes, and that is the usual case. Enter what you hold today: IgniFI starts from there and tracks your net worth from that point on.
So the curve starts on the day you entered the account, and not before. That is short at first, and deliberate: it never reaches further back than what you have told us.
Until an account has a trade history it is marked "Estimated history". The account's completeness bar shows what is missing to reach "Partial history" and then "Complete history", and every purchase date you add lengthens the curve by that much. You can skip that step for as long as you like.
What are the dashboard's "four levers"?
Four measurements you already had, put side by side: what comes in, what goes out, what stays, and the share of your assets that is invested rather than sitting in cash. Every tile links back to the screen its figure came from, so you can go and check it.
It is neither a score nor a level. "Earn" in particular carries no verdict: there is no honest threshold for "enough income", it depends on the country and the household, and a threshold would be an opinion dressed as a measurement.
A tile showing a dash is not a zero, it is a measurement your data does not support yet. The first three need a budget imported over at least three whole months (one month is an anecdote, not a habit); the fourth needs at least one account. The tile then says what is missing.
I mostly want not to lose what I have. Can I set that as a goal?
Yes, it is a goal in its own right: "Preserve my capital", offered in the very first question of the welcome questionnaire and available afterwards in the goal list.
It tracks inflation by default, and that is the most important part. A floor frozen at the amount you entered empties its own promise: €250,000 kept untouched for twenty years buys about a third less, and a card announcing "capital preserved" throughout would be saying something false. So your floor rises with prices from the date you stated the amount, to keep standing for the same purchasing power. The rate used is a 2%-a-year assumption, shown as such and not a forecast, and you can switch the indexing off from the goal itself. The card always shows the amount you typed next to the current floor.
It works the opposite way round from every other goal. You give an amount, but it is not a sum to reach: it is a floor you do not want to fall below. So the goal card shows your margin above that line, or your shortfall below it, rather than "you still have this much to save". It shows no projected date either: a date to reach a threshold you are already above would mean nothing, and a date to fall back below it would be a forecast we refuse to make.
The choice also changes the plan offered at the end of the questionnaire. No suggestion to open an equity wrapper appears, and instead you are pointed at the dashboard checks: cash beyond the deposit guarantee ceiling, a position weighing too heavily in your wealth, two different funds tracking the same index. These are verifiable observations on your own figures, never recommendations.
Is the asset-class breakdown gross or net of my loans?
Both, at your choice, with a Gross / Net switch above the chart. It only appears if you track at least one loan: with no debt the two views are identical.
Neither is "the right one", they answer different questions. Gross is your exposure: a €300,000 mortgaged property moves with property prices for its whole value, whatever you still owe. Net is your ownership: what would be left after selling and repaying. Flipping between them shows you the share that still belongs to the bank.
For a loan to come off the right place, it has to say what it is secured on. The field is on the loan itself, on the Accounts page, and offers your accounts first: picking "Flat in Lyon" is more precise than a class, and the loan then comes off what that account actually holds. A lombard loan secured on a securities account spreads over its equities and bonds in their proportions, which is faithful: the loan really is secured on those holdings. If the collateral has no account here yet, the classes remain as a fallback, defaulting to Real estate. A student or consumer loan finances nothing tracked here: pick "Consumer / Other" and it comes off your total but off no class. Spreading it pro-rata would invent an attribution nobody made.
On the Accounts page, every account with a loan against it shows its own share directly: what is still owed and what is yours, with a small bar. When the account and its loans are in different currencies, say a Swiss-franc loan on a house in euros, the line converts both at today's rate into your display currency and says so. It only stays quiet when one of those currencies has no rate, rather than count a loan at parity; the missing currency is then named under the page's net worth, which flags it as counted at parity. Each loan also states, on its own row, what it is secured on.
The dashboard shows all three figures together under your wealth: gross, outstanding loans, net, with a bar showing the share that is yours. The PDF recap and the monthly email print all three too, since a sheet of paper cannot be toggled.
The INSEE ranking stays on gross, because the figures INSEE publishes are gross wealth. Comparing a net figure against gross benchmarks would give you a wrong rank.
Why does the “net of debt” line start later than the other one?
Because we did not invent it. Your assets have a history because a point is recorded every day; your loans hold only a present-day amount. Subtracting today's balance from every past point would draw a loan that never moved, which is the one thing a loan always does.
So the debt is recorded alongside the assets, day after day. The dashed line starts on the day that recording began, and extends on its own from there.
It can also reach backwards, but only if your loans carry an amortisation schedule: a schedule states what was owed on every date it covers, whereas a hand-entered balance speaks for one day only. You can import one from the loan itself, PDF included.
Wherever even one of your loans cannot be reconstructed, nothing is recorded for that date: the line breaks rather than being drawn too low. A segment joining the two edges would assert a debt nobody wrote down.
What is the opening date on my PEA for?
To run the five-year clock, which is the mechanic that defines the PEA. Until the date is filled in, the account shows nothing: there is nothing to count from a date nobody gave.
What changes after five years: before, a withdrawal closes the plan and the gain is taxed at income tax plus social levies (exceptions exist, notably redundancy, invalidity, early retirement, or starting a business since the PACTE law). From five years, the gain is exempt from income tax, social levies remain due, a withdrawal no longer closes the plan, and you can keep paying in.
One thing to watch about the date: it is the FIRST PAYMENT, not the signing. Your bank often shows an earlier contract date, and counting from it would announce the five years too soon. Being wrong in that direction costs money: it would mean telling you a withdrawal is exempt when it would in fact close your plan and be taxed.
The PEA-PME runs on exactly the same clock. IgniFI shows the days remaining and the exact date, and only shows them: whether to withdraw is about your situation, not ours.
The explanations vanished from the screen, how do I get them back?
They fold themselves away once read, and live behind the small question mark that replaces them. One tap brings the text back, and it will not fold again on your next visit.
The pace depends on the screen: once on a phone, three times on a wide one. That is not arbitrary - the same paragraph takes a far larger share of what a phone can show at once, so it costs more per reading. You can also close one yourself with the cross: IgniFI then treats it as settled and stops offering it.
To bring everything back at once, go to Settings, "Help and guides", and press "Show all again". Useful after a few months away, or when somebody else discovers the app on your screen.
One thing never folds: the warnings. A note saying a history is estimated, that an account has no recorded movements, or that a curve starts on a given date is not an explanation, it is the reason a figure on screen may not mean what it looks like. Hiding them after three readings would turn an honest product into a confident one. The internal rule is simple: if hiding it merely leaves you less informed, it folds; if hiding it makes a figure misleading, it stays.
The memory belongs to the browser, not to the account: on another device the explanations start over. That is deliberate - a phone and a computer are two places where you learn a product.
What is each page for?
Dashboard: your total net worth, how it moves, your allocation and your goals. The overview.
Accounts: the list of your accounts and what is inside them. This is where you add an account, a holding, a movement or a loan.
Budget: your income and spending, from your bank statements.
Tools: the Stress Test, the Withdrawal plan, the Property estimate and the Anti-Fragile simulator. Coaching, the Blog and the help are in the menu too.
Settings: your settings, subscription, security and data export. Not to be confused with the Accounts page, which is about your bank and brokerage accounts.
The recap, the INSEE rank and the PDF: what is the difference?
Two objects, made for two uses.
The recap card is made to be posted. It therefore shows percentages only and no amounts: your progress, your savings rate, your rank. That is a rule, not a setting.
The PDF recap ("Detailed recap as PDF", from "My recap") is a private document you keep. It shows your amounts, your rank, the next rung and your four levers, and is produced with "Save as PDF" from your browser's print dialog. If you plan to forward it, a tick box removes every amount before printing.
The rank comes from INSEE's household wealth survey: it compares your gross wealth with households in your age bracket and family configuration. It is an indicative estimate, never an official ranking. The next rung is computed on the same curve: it says what stands between you and the threshold above, and never how to cross it.
Is there a mobile app?
IgniFI runs in your phone's browser, with nothing to download from a store. You can install it on your home screen to open it full screen like an app: on iPhone, the Share button then "Add to Home Screen"; on Android, Chrome's menu then "Install app".
What is the interactive lexicon for?
Once switched on, it underlines technical words with a dotted line throughout the app: ETF, savings rate, borrower share, ongoing charge, net worth. Hover the word on a computer, tap it on a phone, and its definition appears without leaving the page.
It is off by default. Nobody wants dotted lines under a third of the words on a screen they have been reading for six months, and only you know when that moment comes.
Where do I switch the lexicon on or off?
Two places, and it is the same button in both directions. At the top right of every page on a computer, in the menu on a phone. It is also in Settings, under "Help and guides".
A reminder also sits at the bottom of every definition, for when you have switched it on and are looking for the way back.
How do I see the getting-started guide again?
From Settings, under "Help and guides", the "Reopen the guide" button. It also opens from My accounts via the "Add an account" button: that button launches the guide, it does not lead to a blank form.
The guide asks what kind of account you are adding, then shows you where to find the export at your broker. Reopen it as often as you like, even with accounts already saved.
Can I keep a property estimate made before I had an account?
Yes. After an estimate, create a free account: on the first dashboard load, IgniFI offers to add that property with the value already filled in. Confirm it, and your net worth has its first figure.
The estimate is kept in your browser, not on our servers, and it is forgotten after thirty days: a market figure several months old must not quietly become the opening value of your wealth.
How many property estimates can I run without an account?
One a day. The full result is shown, land included: nothing is hidden.
With a free account you can run as many as you like, keep a value history for your properties, and unlock the refinements (energy rating, furnished letting, parking, outdoor space) that adjust the estimate to your specific property.
What can the assistant do, and what can it not?
It answers questions about how IgniFI works, from this help centre and nothing else. If the answer is not in it, it says so and offers to put you in touch with us, rather than inventing a button or a menu.
It never sees your data: not your accounts, not your holdings, not your net worth. That is not a limitation to lift later, it is a decision: an assistant that can read a portfolio ends up looking like it is advising on that portfolio.
So it never recommends an investment, a product, a broker or a tax treatment, and never says whether something is a good idea for you. Those questions belong to the coaching or to a licensed adviser.
Do I have to add all my accounts to IgniFI?
No. IgniFI works with what you declare and nothing more: you can start with a single account and add the rest whenever you like, or never.
The trade-off is simple: every figure reflects only the accounts entered. Total net worth, allocation, your goals' dates, the INSEE rank and the four levers are computed on what is there, and a missing account counts nowhere. To keep an order of magnitude meanwhile, the quick estimate takes three amounts from memory; while your tracked accounts cover less than that, the dashboard shows what is left to link.
A goal can also follow only "Specific accounts", which lets you track a project without entering everything. The free plan tracks 1 account.
What is the quick net worth estimate for?
To get a first figure in thirty seconds, with nothing connected. Three amounts from memory: "Available savings" (current account, savings accounts, euro funds), "Investments" (at today's value, not what you paid in) and "Property" (the value of the home, loan not deducted). Your estimated gross net worth and your INSEE rank appear as you type.
It is offered at the end of the opening questionnaire and on the dashboard. Once saved it acts as a yardstick: while your tracked accounts cover less, a card shows the difference left to link, and "My estimate was wrong, clear it" removes it. It is an estimate, not tracking: nothing in it updates on its own.
How much time does it take each month?
A few minutes. Prices of listed holdings, currency conversions, savings interest and every projection recompute on their own. What needs a gesture is the accounts with no price: a managed life-insurance policy, a pension plan, a property, a savings account whose balance moved.
You do not have to keep a list: the banner at the top of the Accounts page names the accounts to update and offers a field to do it on the spot. A reminder goes out on the 25th, only if an account is past its usual rhythm, and the report on the 1st carries the same list. The budget updates by importing a statement.
What can I use without creating an account?
Several tools are open without signing up: the demo ("See a filled demo"), which shows the real screens with an invented net worth; the Stress Test, as a trial on a €100,000 example portfolio; the Property estimate, one estimate a day; the Anti-Fragile simulator; the Glossary, the Blog and this help centre.
Anything about YOUR figures needs an account: your accounts and their holdings, your budget, your goals, the recap and the assistant. The free account has no time limit.
What is the demo?
IgniFI's real screens, filled with a fictional but realistic net worth: dashboard, budget, goals, withdrawal plan and a way into the stress test. Open it from the home page with "See a filled demo", without signing up or typing anything.
None of the figures belongs to anyone: they are generated from a typical scenario, and a banner says so. The demo budget is read by the same engine as yours. The withdrawal plan starts from the demo's financial independence goal, in the month its card says it is reached, and recomputes its verdict as the monthly spending moves. "Open the stress test" carries the demo's allocation to the public Stress Test, sliders already set. Editing a goal or saving anything needs an account.
How do I create an account?
From "Create an account": an email address, a password, and accepting the terms and the privacy policy. The password must meet the criteria shown under the field (minimum length, lower case, upper case, digit, special character), and a password that has appeared in a data breach is refused.
A confirmation link is then sent to your address: until it has been opened, signing in is refused. Nothing after a few minutes? Check your junk folder, or use "Resend the email". An automatic anti-bot check also protects this page. No banking details are asked for.
What is the opening questionnaire for?
It is the set of questions asked right after signing up: your main goal, your age, your household (optional), your tax residency, how much you can save each month and, depending on the goal, your spending once independent or the amount you are aiming for, possibly your tax bracket, then a quick estimate of your net worth. Your answers create your main goal and decide the next steps offered.
Nothing is final: the Opening questionnaire can be redone from Settings, under "Help and guides", starting from your current answers, and it updates your main goal instead of creating a second one.
How do I switch the app to French?
With the FR button, at the top right of every page, or in the menu on a phone; the same button shows EN to come back to English. You stay on the same page. The app, the help, the glossary and the assistant exist in both languages.
The language changes neither your amounts nor your currency: the display currency is set separately, on the dashboard.
What is in the dashboard's tabs?
The Dashboard has two views, "Wealth" and "Spending". On the wealth side, four tabs: "Trend" (net worth, gross and loans, the curve, the performance and the index comparison), "Goals" (your goals, their estimated date, their progress over time and the savings projection), "Allocation" (asset classes gross or net, split by account, concentration, allocation history) and "Analysis" (fund fees, dividends, every holding in detail).
The Spending view summarises your budget. At the top, a card suggests the most useful next step; the currency picker and "Refresh" sit at the top too.
What does IgniFI not do?
IgniFI connects to no bank and no broker: nothing syncs automatically, you import or type in your figures. It places no orders: you cannot buy or sell a security from the app, only record what you did at your broker. It does not hold your money. It gives no advice: no recommendation of any investment, product, broker or tax treatment.
Prices are closing prices updated every weekday evening, not real time. There is no app to download from a store: IgniFI runs in the browser and installs on your home screen. Finally, an account belongs to one person, with no shared access.
Accounts and holdings
How often do I need to update my accounts?
The app tells you, account by account, so you do not have to keep track. At the top of the Accounts page a banner lists what has aged, with a field to fix it on the spot when the account comes down to a single figure. The monthly report carries the same list.
The expected rhythms differ because what keeps an account true differs. An assurance-vie or a managed PER: about a month, because the insurer publishes a value and nothing else moves it between statements. A securities account or a PEA: about a quarter, because prices update themselves every night and only the QUANTITIES can have changed without being recorded. A savings account or a property: about a quarter too, with interest accrued for you in the meantime.
One important point about the date shown. It is not the last database write: the price robot touches every line it reprices each night, so a securities account would look updated every evening even if nobody had opened it for two years. The date shown is the last time YOU said something: a recorded order, a dated quantity, a dated value, a contribution, or an edit to a balance the robot never writes.
An account never filled in is kept distinct from one that is merely late: they are not the same problem and they do not call for the same sentence.
No entry can create a duplicate. A value saved on a date that already carried one replaces it, and the app says so before it does.
My flat is owned with someone else: do I enter the full value or my half?
The FULL value, always, and you state your share next to it. On the holding's row, on the Accounts page, a "Your share?" button lets you enter your percentage; IgniFI then applies that share everywhere it talks about your wealth.
Why not simply enter your half: because the value is not yours to choose. An agent's estimate, a notaire's deed, a DVF comparison and the built-in estimator all quote the whole property. Asking you to halve every figure you are handed, on every update, is handing you arithmetic the app does better, and the first time you forget, your wealth doubles.
It is also what keeps the two sides of the balance sheet in step. Your loans carry a share too: with two borrowers on €300,000, the app counts only €150,000 of debt. With no share on the property, the same couple would show €400,000 of real estate against €150,000 of debt, which is €200,000 belonging to somebody else, in the dashboard figure, in the INSEE ranking, in every goal and in the monthly email.
The share is not reserved for property: a jointly-held securities account and a portfolio held between heirs are exactly the same fact, and the button appears on every holding. It does not have to be 50%: 60/40 is common when one partner put in more of the deposit.
The row then shows both figures, the percentage and what it comes to in euros, so you never have to work out which of the two the rest of the app is using.
What do my investments really cost me?
The dashboard brings together the three fees you pay, below the performance. Fund charges, taken inside the net asset value and therefore never visible on a statement. Contract management fees, taken every year from the amount held in an assurance-vie, a PER or a managed mandate. And the dealing fees actually charged on the movements you recorded.
The first two stack, and that is not double counting: the insurer takes its percentage of the contract, the fund takes its own inside its own value. It is precisely because they are never shown together that each one looks small.
Two figures are shown, and never their sum presented as an annual cost. Recurring fees are a rate applied to what you hold today, so an estimate. The last twelve months of dealing fees is money that has already left, so an observation. Adding a past payment to an annual rate gives a figure that looks precise and means nothing.
The 20-year projection assumes 5% gross a year, and says so. It covers only the recurring fees: compounding past dealing fees for 20 years would be arithmetic applied to the wrong object.
Management fees are entered account by account, on the Accounts page. Nothing is pre-filled: two contracts at the same insurer can be half a point apart depending on the year and the distributor, and putting an invented figure at the heart of the card whose whole job is to show that fees are real would be absurd. Until an account has a rate, the card names it rather than counting it as free. The rate is on the contract's annual statement.
How do I know which of my accounts is performing best?
The dashboard offers a comparison of your accounts, below the overall performance. It is not computed by default: each account means rebuilding its whole history, so the calculation starts when you click.
The important part is the period. Every account is measured over the period they have IN COMMON, and that period is printed above the ranking. Comparing a PEA opened in 2019 against a mandate opened last year, each on its own history, ranks them by opening date: the PEA carries a crash and a recovery, the mandate carries only the recovery. The ranking would reward the calendar rather than the account.
The return used removes your deposits and withdrawals, otherwise the account you pay into most would always come first. An account with no recorded movement carries a warning, because in that case a deposit looks like a gain.
Some accounts are not ranked, and the reason is shown next to their name: history under 90 days, not enough period in common with the others, or a history rebuilt rather than measured. A figure would exist in those cases, but it would describe our reconstruction rather than your money.
How do I add an account?
From the Accounts page. Three ways in: "Getting started" if this is your first account, "Add manually" to search for your holdings one by one, "Import a file" if you have a CSV or Excel export.
You then pick a wrapper: PEA, PEA-PME, CTO, Swiss CTO, life insurance, PER, savings account or Other. It drives the tax treatment shown and adapts what IgniFI asks you for next.
What kinds of accounts can I track?
The wrappers offered are: PEA, PEA-PME, CTO, Swiss CTO, life insurance, PER, savings account, and Other.
"Other" covers everything else: crypto, property, cash, precious metals. Depending on what goes in it, there are two ways to enter a holding. A quoted asset (a coin, for instance) is searched by its symbol and entered as a quantity, like any other holding. An asset with no market price (a property, a stake in a company) is entered as a value, picking its asset class: Property, Commodities, Cash or Other.
How do I track crypto held on several platforms?
One account per platform, with the "Other" wrapper. A "Binance" account, a "Revolut" account, a "Ledger" account if you self-custody. In each one, search for the coin by name or symbol (bitcoin, BTC, ETH) and enter the quantity held ON THAT PLATFORM, in coins rather than in euros. Prices update like any other holding.
Only one line per coin appears in the search, and that is deliberate: BTC-EUR and BTC-USD are not two assets but two ways of quoting the same one. The currency you read values in is set once for the whole app, not per position.
One account per platform rather than a single "Crypto" account, because that is what lets you reconcile each statement separately, and because the completeness bar then tells you where movements are missing. Holding the same coin in two places does not blunt the concentration warning: IgniFI adds up one instrument across your accounts before working out its weight.
Worth knowing: the free plan tracks 1 account, and IgniFI+ 2 accounts. On the tax side, a digital-asset account held outside France must be declared each year by a French tax resident.
My savings account earns interest. How do I track it?
Enter the annual rate on the position, next to the balance. IgniFI then compounds it daily from the date you give, and the displayed value climbs on its own without you touching anything.
What is stored stays exactly the balance you typed: interest is recomputed on read, never written back. A position looked at a thousand times therefore cannot drift.
Changing the rate does not rewrite the past. The account really did earn the old rate over the old period, and recomputing it would contradict a statement you can check. So on a change the interest earned so far is banked into the balance, and the new rate runs from that day.
Two limits, stated rather than hidden: daily compounding is an approximation (a French regulated passbook accrues by fortnight and credits on 31 December, a few euros a year apart on ten thousand), and a rate above 25% is refused as a typo.
What is the account completeness bar for?
It shows the quality of an account's data, not your performance. Three states: "Estimated history" (today's holding is known, its origin is not), "Partial history" (some movements are there) and "Complete history" (buys and sells recorded, so performance and invested amount are exact).
It then suggests the next step, which depends on the account type: "Add your orders" for a securities account, "Add your contributions" for a managed contract, "Give the dated value" for a savings account, a property or a contract.
What is an opening position?
It is the total you held on a given date, before any movement recorded in IgniFI. It is the starting point: the buys and sells you enter afterwards add to or subtract from it.
If you later enter a buy dated BEFORE that date, IgniFI understands the trade was already part of the opening total and reduces the opening position accordingly, rather than counting the shares twice.
How do I record a buy or a sell?
On the Accounts page, expand the holding and open "Movements". Pick Buy or Sell, then fill in the date, the quantity, the unit price and the fees. Every field matters: this is what makes the invested amount and the performance correct.
As you type, IgniFI compares your unit price with the closing price on the date you chose and warns you if the two are far apart. That is what catches a misplaced decimal or a total typed where a unit price belongs.
Settings is under a managed mandate. What should I enter?
The contract's value, plus your contributions and withdrawals through the "Deposits & withdrawals" panel. You do not need to record the manager's own trades: IgniFI measures performance with your inflows and outflows neutralised, so paying in 500 euros never shows up as a gain.
Where you can, also give the contract's total value on the day of the movement: it is on your statement and it is what makes the performance exact. A self-directed life-insurance policy, on the other hand, is entered like a securities account, line by line.
When are prices updated?
Every weekday evening, after the markets close. The prices shown are closing prices, not live quotes: IgniFI is a wealth tracker, not a trading platform.
On a weekend or a public holiday you therefore see the last session's close. The "Refresh" button on the Dashboard reloads your holdings and the chart; a holding you have just added takes a moment to pull its history.
My holding has no price, or cannot be found
Search by its ISIN, the twelve characters printed on your statement (FR0010315770, IE00B4L5Y983…): it names one instrument, while a name can match another (the name Sanofi also brings up the US depositary receipt, worth half a share). Then look at the suffix: it tells you the listing venue (.PA for Paris, .DE for Germany, .L for London). The same ETF often exists on several exchanges, quoted in different currencies. Pick the line whose price and currency match your statement.
If the instrument genuinely is not listed (an unlisted fund, a property fund unit, an insurer's in-house vehicle), create an account with the "Other" wrapper and track it by value: you enter its amount and update it whenever a statement arrives.
My holding had a stock split. What do I do?
Record it as a "Split" movement on the holding, with its ratio (for instance 4 for 1, or 1 for 10 for a reverse split): the quantity is multiplied, the invested amount and realised gain do not change, no money moves. When IgniFI spots a split missing from your movements, it offers "Record the split". This is only possible on a line that has recorded orders.
The historical prices we use are adjusted for splits. If you enter an earlier order at its original price, IgniFI warns you, because the gap with that date's adjusted close looks like a split. With no recorded orders, simply check that the line's quantity is the post-split one.
How is the invested amount calculated?
As a weighted average of your purchases, including acquisition fees: every purchase recomputes the average, and a sale does not change the invested amount of the remaining shares. This is the figure behind the unrealised gain shown on each line.
How are currencies converted?
At European Central Bank rates. A present-day value is converted at today's rate; a past transaction is converted at the rate of ITS own month, not today's, otherwise a 2019 purchase in dollars would be told with a 2026 exchange rate.
Showing your whole net worth in Swiss francs, dollars or gold is possible on every plan, from the dashboard's picker.
How do I track a property?
Create an account with the "Other" wrapper, then enter a value and pick the "Property" asset class. You update it whenever you want.
The property estimation tool gives you an order of magnitude from actual recorded sale prices in your area (public French DVF data), which you are free to replace with your own figure. The mortgage is entered separately under "Loans & credit": your net worth then reflects the outstanding capital.
How do I enter a loan?
On the Accounts page, under "Loans & credit", button "Add a loan". Enter the outstanding capital, the annual rate (the borrowing rate from your offer, insurance excluded: not the APR), the total monthly payment including insurance and, under "Of which insurance", the borrower's insurance part. These amounts are in the currency picked next to the outstanding balance: a Swiss-franc loan is entered in francs, and your net worth converts it at today's rate. Start and end dates are optional; "Import schedule" replaces typing with the bank's schedule.
The outstanding capital is deducted from your net worth and falls as instalments are paid. You can also record your share when a loan is jointly held, and what it finances, so it comes off the right account. Loans follow the same plan limit as accounts.
Can I see what I held on a past date?
Yes, with "Your holdings as of…": pick a date and IgniFI reconstructs your positions as they were that day, account by account.
Each line is marked "measured" or "estimated". Measured means a recorded movement or a dated position covers that date. Estimated means the quantity comes from the last known position, carried across a period the account already existed in but where nothing was attested.
Before the first trace of a holding in your data it is no longer estimated at all: it is left out of the total and named underneath. We do not know what you held before we heard of it, and filling that blank with today's positions would produce something that looks like a statement without being one.
How do I correct or delete a holding?
On the Accounts page, expand the account: each line can be edited (quantity, invested amount) or deleted. Deleting a holding also removes its movements.
If the total is wrong rather than the line, first check whether an account was imported twice: that is the most common cause, and far quicker to fix than reworking every line.
Does the property estimate account for the land?
For a house, yes, if you enter the land area. The gap between your plot and that of comparable houses is priced separately, at the price per square metre of land computed from those same notarised sales.
Without a land area, your house is valued as if it stood on a plot of the size that is usual around there. For a flat the question does not arise: the parcel belongs to the whole building.
If local sales do not allow the land value to be separated out, the estimate says so instead of producing a figure.
What does the "This is my main residence" box do?
It tells IgniFI which property is your home, because a home is not treated like an investment. Ticked on the property's account, it takes the main residence out of the "invest" lever, removes it, together with the loan that finances it, from the wealth your financial-independence and retirement goals are measured on, and makes the Stress Test apply French existing-home prices to it rather than listed property companies. In the income-loss scenario it is never sold.
It still counts in your gross and net worth and in the INSEE rank. The box is unticked by default: until a property is marked as such, it counts like the others. A rental property or a property fund stays an investment.
How do I rename, close or delete an account?
From the Accounts page, in the account's actions. "Rename" changes its name; two accounts cannot share one, because the history files each account under its name.
"Close (keep the history)" is meant for an account you closed at your bank: its holdings go to zero from today and its whole past stays in your curves. "Delete" erases the account, its holdings and its trace in your net worth history, as if it had never existed: keep it for a typing mistake or a duplicate.
To update a balance, do I correct it or add a line?
You correct it: "Correct the balance" (or "Correct the value" for a contract or a property) replaces the old amount with the new one. The banner at the top of the Accounts page also offers a field for each account due an update, with the date of the value.
"Add a line to this account" does something else: it adds one more line, which adds to the total. Entering your new savings balance that way would count it twice, which is the most common reason a net worth suddenly doubles.
For an amount on a past date, "Date a value" records the balance on the statement's day: the curve places it on that date, and a savings account's interest restarts from there.
Can I show my net worth in Swiss francs, dollars or gold?
Yes, on every plan. The picker at the top of the dashboard offers EUR, CHF, USD and gold (in ounces), and the same one sits in Settings under "Region & currency". Your accounts and holdings each keep their own currency; only the total is converted, at today's rates.
The default currency follows your tax residency: until you choose one, changing the region moves it to the new region's, and Settings says so beside the region, with a button to keep the previous one. A currency you chose, or kept, stays yours whatever your residency: a cross-border worker taxed in France can read their net worth in Swiss francs. The withdrawal plan has its own picker. The budget is always kept in euros, each foreign transaction converted at its historical rate.
What happens when I change an account's ownership share?
The change is recorded on its date, without rewriting the past: before that date the curve keeps the old share, after it the new one. The break is marked on the chart, and the jump it creates is taken out of the performance like a deposit or a withdrawal: going from 50% to 100% of a property is not a market gain. The dashboard's change sentence also states the part due to the changed share.
Recorded orders follow the share of their own day. If a loan secured on the account has a different share, IgniFI offers to align it ("Yes, align").
Performance, net worth change, IRR: what is the difference?
Three figures, three questions. "Listed investments performance" measures what your listed holdings earned with your buys, sells and contributions neutralised, dividends reinvested: it is the only figure compared with the index. "Net worth evolution" covers everything you own, savings and property included, and includes money added: paying in €10,000 lifts it without changing the performance at all.
The IRR, the "return on your money", weights each period by the sum invested in it: it parts from the performance when you bought a lot just before a rise or a fall. Neither it nor the annualised performance is shown under 60 days of history.
Without cost prices and purchase dates, performance comes down to the change in value: fill them in to make it exact.
Why is my gain shown in dollars and in euros?
Because they are two different figures. On the line of a security quoted in dollars, the gain is given in its own currency, marked "excluding FX": that is what the security did. Beside it, the euro effect, "FX included", adds what the dollar did against the euro since your purchases, converted at the rates of their dates.
When a purchase has no rate on its date, a monthly rate or today's replaces it, and the screen says the currency effect is approximate.
How does IgniFI count my dividends?
In two ways that never mix. The dashboard's "Dividend income" card estimates a yearly pace: dividends paid over the last twelve months, times your current quantity, gross, with a net estimate depending on the wrapper. It is an estimate, not a statement.
Dividends actually received are read only from broker statements you import; they are never guessed, and then appear apart from the gain. The performance curve is computed with dividends reinvested, and says so.
How do I import a loan's amortisation schedule?
On the loan's line, under "Loans & credit" on the Accounts page, button "Import schedule": PDF, Excel or CSV. The document is read by Google Gemini to extract the schedule, a spreadsheet included, which is turned into text in your browser before sending; each analysis counts against your AI import quota.
Once imported, the outstanding capital updates itself at each instalment and the end date is recomputed. The schedule also lets the "net of debt" line reach back into the past, and the budget state how much of your repayments is capital. Check the balance shown after import: extraction can be wrong.
Where do the prices and exchange rates come from?
Stock prices and their histories come from Yahoo Finance: they are closing prices, fetched every weekday evening, not live quotes. Exchange rates are the European Central Bank's reference rates. No personal data is sent to obtain them.
Historical prices are adjusted for stock splits. Properties, savings accounts, unlisted funds and managed contracts have no price: their value is the one you enter.
Imports
Which files can I import?
CSV and Excel, for bank statements as well as broker transactions: the file is read directly in your browser and never leaves your device.
PDF works differently: it is sent to an AI to extract the data, only after your explicit, case-by-case consent.
How do I use the movements import template?
Expand a holding on the Accounts page, open "Import", then "Download the template": it arrives pre-filled with the account and the ticker. The columns are Date, Type, Quantity, Unit price and Fees. One row per order, Buy or Sell, dates as YYYY-MM-DD or DD/MM/YYYY. Delete the example rows, then "Import the filled template".
A review screen then shows every row that was read, which you can edit, untick or delete. Nothing is saved until you confirm.
How does the AI statement import work?
You drop in a PDF statement through "Broker statement (AI)", or "Import a statement" on the Budget side. It is analysed by Google Gemini to extract dates, labels and amounts, and the result is shown to you for review before anything is saved.
This is the only IgniFI feature that sends a document to a third party, it is never enabled without your explicit consent. The free plan offers 2 to try it, IgniFI+ and Pro a monthly quota. You can redact your name, address or account numbers first: the extraction only needs dates, labels and amounts. If you want full control, stay on the CSV or Excel import, which is local and unlimited.
Are duplicates detected?
Yes. On the review screen, any row identical to a movement already recorded (same date, type, quantity and price) is flagged "duplicate?" and left unticked. You only tick it if these really are two separate orders.
Two other flags appear in the same place: "different instrument?" when the statement mentions a symbol that does not match the holding, and "different currency" when the row is not in the holding's currency.
My import found nothing, or the amounts are wrong
Check the decimal separator and the date format first: a French file uses a comma and day/month/year, an English one a dot and month/day/year. The review screen shows what was read, which is where the mistake becomes visible.
A scanned PDF, a screenshot or a heavily formatted statement sometimes reads badly. If so, export the same statement as CSV from your bank, which is both more reliable and free. If the problem persists, send us the file with your personal details redacted.
How do I import my holdings from a file?
The "Upload your portfolio" page, opened by "Upload a file" on the Accounts page: drop your broker's CSV or Excel export, or a PDF, read by AI once you agree. Name the account, give the statement's "As of" date, then check the preview: every cell can be corrected, "Auto-detect" looks up the tickers, and rows in error are flagged before saving.
When a PDF statement prints the account's total value, the preview compares it with the sum of the lines, at every correction: "Checked" when they add up, the gap otherwise.
Re-importing under the same account name replaces its holdings, which avoids duplicates. A statement dated more than 366 days ago is treated as a historical statement, a Pro plan feature.
How do I rebuild my net worth history?
With "Reconstruct my history", on the import page, a Pro plan feature. Two columns are enough in a CSV or Excel file: the date and the total of your assets that day, debts not deducted; you can also enter the points row by row. The detected date format is shown, and can be switched between day/month and month/day.
Each row becomes a point on your curve, and each point can be deleted from the same page. For a finer curve, account by account, fill in purchase dates on your holdings or dated values on your accounts instead.
Can I import a statement from the assistant?
Yes, with "Import a statement or paste lines", in the assistant's window. Drop a PDF, a CSV, an Excel or a text file, or paste lines copied from Excel, an email or your bank's page. A CSV or Excel export from your bank is first read in your browser, without AI and without counting against your quota, then opens in the Budget. Anything else is read by Google Gemini, which identifies its type (bank statement, portfolio statement, order history, amortisation schedule); you confirm or change where it goes.
A bank statement goes to the Budget and a portfolio statement to an account, through "Review and import" on the usual screen: nothing is saved without your approval. Orders and amortisation schedules are imported from their own screen, which the assistant points you to. The document never goes through the conversation, and the extraction waits for your approval thirty minutes at most. Each import read by AI counts against your AI import quota.
How many AI imports do I get, and how big can a file be?
The free plan offers 2 AI imports for life, to try it; IgniFI+ gives 15 a month and Pro 20 a month. The counter is shown when you import, and the same quota covers statements, amortisation schedules and imports through the assistant. A PDF must not exceed 4 MB.
CSV or Excel import has no limit on any plan, and the file is read in your browser without going through an AI. When the quota is used up, exporting the same statement as CSV from your bank is always possible.
Which brokers and banks are recognised on import?
The add-an-account guide shows where to find the export at Boursobank / Boursorama, Fortuneo, Trade Republic, BNP Paribas, DeGiro, Trading 212, Saxo Bank, Scalable Capital, Revolut, Swissquote, Interactive Brokers, PostFinance, UBS / Credit Suisse, Linxea / Linxea Spirit, Ramify, Yomoni / Nalo, Binance, Coinbase, Kraken and Ledger. On the budget side, the formats of the main French banks and neobanks are recognised automatically.
An institution missing from the list is no obstacle: drop its export anyway, the generic column detection works on most files, and the preview shows what was read before anything is saved. Otherwise a PDF can be read by AI, or the holdings typed in by hand.
Budget and spending
How do I import my bank statements?
On the Budget page, button "Import a statement": drop in your bank's CSV or Excel export. The formats of the main French banks and neobanks are recognised automatically, including which bank the file came from, based on its name.
"Enter manually" lets you add a single transaction by hand, with no file.
How is my spending categorised?
Automatically, from the transaction label. The category stays editable line by line, and your corrections are kept.
Two categories are not spending and are handled separately: "Internal transfer", which moves money between your own accounts, and "Savings & invest.", which leaves your current account without being consumed.
How is the savings rate calculated?
Income minus spending, over income, for the month in question. Internal transfers and money paid into your investments are excluded on both sides: moving 500 euros to your share account is not spending, it is the very thing being measured.
The same calculation is used in the app and in the monthly email report.
I have spending in a foreign currency
They are converted to euros at the rate of the month they happened in, not today's rate. A trip paid in yen last year is therefore reported at last year's exchange rate, which is the only way to get an accurate savings rate.
Which categories does the budget use?
Income: Earned income, Rental income, Investment income and Transfers received (money another person sends you). Spending: Housing, Insurance, Energy, Food, Restaurants, Transport, Health, Sport & gym, Wellbeing, Leisure, Shopping, Home & maintenance, Subscriptions, Transfers to others, Cash / ATM, Taxes, Loan, Bank fees, Travel, Family, Refund and Other. "Refund" takes money paid back when the label does not say for which purchase (a friend paying their share): it reduces your spending instead of counting as income.
Three categories are neither income nor spending: "Savings & invest.", money put aside or invested, which makes your savings rate; "Internal transfer", between your own accounts; and "Card settlement (purchases counted)", the debit of a deferred-debit card whose purchases are already in the budget. Each transaction is categorised automatically from its label, and stays editable.
How are refunds counted in the budget?
As a reduction of the refunded spending, not as income. A refund filed under a spending category (Health, Shopping, Travel…) lowers that category; if it goes below zero over the period, the screen shows "refunded". So your savings rate is not inflated by a health-insurance payout or a returned purchase.
When entering income by hand, choose the "Refund" type and the refunded category. A credit left under "Other" stays income, so that a client's payment does not become negative spending.
Are my loan repayments counted as spending?
Yes: they are recognised under the "Loan" category and counted as spending, because it is money that leaves every month. When IgniFI can read your loans at both ends of the month (an imported schedule, or enough of rate, payment and dates, in euros), the category states how much of it is capital repaid: the part that reduces your debt instead of disappearing.
That detail only appears if every one of your loans can be read this way; otherwise nothing is shown rather than a partial figure. A loan being paid out into your account is never filed under "Loan".
I have a deferred-debit card: is my spending counted twice?
No, if your card purchases are imported. The card's monthly debit is matched against the card purchases of the previous calendar month: when they add up to the same amount, give or take a small gap, it is filed as "Card settlement (purchases counted)" and leaves spending, since every purchase is already there.
When the purchases do not match, the debit stays counted and IgniFI asks whether those purchases are already imported. Answer "Yes, don't count it" if you imported the purchases another way, or "No, count it" if only the debit is in your budget. A refund on the card reduces the expected bill.
How do I set and follow budget targets by category?
In the "Monthly targets by category" card on the Budget page, button "Set my targets": a monthly ceiling per category. You can then look at a month, a quarter or a year to see whether you kept to them; over a period, the target used is the sum of the ceilings in force each month.
Changing your targets does not rewrite the past: the new ones apply from the month stated, and earlier months are still judged on the ones in force at the time. A correction made within the same month replaces that month's. A month in which a category had no target is not counted for it.
How are transfers counted: to myself, to savings, to someone else?
Three cases. A transfer between your own accounts goes under "Internal transfer": it is neither income nor spending. When you import a statement, IgniFI looks for its twin line on your other accounts (same amount, a few days apart) and offers it on the review screen: ticked, it is filed on both sides; untick those that are not the same money. Currency conversions between your accounts are offered the same way ("Tag as transfers").
A received transfer that is large, comes back every month or carries your name is asked about before the import: income, your own money from an account you have not imported (it then does not count), or a refund. The import waits for your answer, because a transfer from your savings counted as income inflates your savings rate.
Money paid into your investments goes under "Savings & invest.": it leaves the current account without being consumed, and it is what makes your savings rate. A transfer to another person goes under "Transfers to others" and always counts as spending; a transfer received from another person goes under "Transfers received" and counts as money in (if it pays you back for a purchase, file it under that purchase's category instead). Cash withdrawals go under "Cash / ATM".
How does IgniFI spot my subscriptions and fixed bills?
From your imported transactions: payments that come back at the same rhythm (weekly, monthly, quarterly, yearly…) appear under "Recurring expenses", in two lists: "Subscriptions" (what you can cancel: streaming, phone, gym, software) and "Other recurring expenses" (loan instalments, rent, taxes, insurance, energy). Every subscription is a recurring expense; a loan instalment is recurring without being a subscription. A line marked "To check" or "To confirm" is a hypothesis: it is left out of the yearly cost shown. When the doubt is about the merchant, the AI proposes a side ("AI suggestion") that you confirm in one click.
In the transactions table, each expense carries a tag: "Subscription", "Recurring" or "Recurring?". Click it to choose; the choice applies to every line from the same payee and is saved to your account. "Not recurring" removes a line; it comes back in one click.
How many months of budget can I look at?
On the free plan, the 12 most recent months that contain transactions; IgniFI+ and Pro open the whole history. Older transactions are not deleted: they stay saved and reappear with a paid plan.
The budget holds up to 250,000 transactions per IgniFI account, and the FIRE date computed from the budget rests on the average of your last complete months, twelve at most.
We are a couple: how is a shared budget counted?
Import the household budget as it is, then fill in "Your share of the budget (%)" in Settings, under "Your household". The budget is still shown for the whole household, but projections add only your share of the savings to your net worth: the FIRE date computed from the budget and the Stress Test's income-loss scenario both use it.
Left empty, the share is 100%. As a couple, half is suggested without being imposed, and leaving "Couple" resets the share to 100%. Amounts you type yourself, such as a goal's monthly saving, are never divided: they are already yours.
Why does the budget flag a gap with my portfolio?
Because two of your figures tell different stories. Over the last three complete months, IgniFI compares the net saving your budget shows (what went to savings and investments, minus what came back) with the net contributions recorded in your accounts (deposits entered, purchases including fees, minus sales and withdrawals). When the gap is clear, a line flags it.
Most often one side is missing movements: a deposit not entered on the account, or a bank statement not imported. Nothing is said if one of the months is not imported or there is neither a savings line nor a movement. If you enter both a deposit and the purchase it funds, both count, and the line says so.
Can my bank transactions be imported twice?
No: on import, every transaction already in your budget is recognised as a "Duplicate" and skipped, and the review screen counts what is new. Re-importing a statement that overlaps the previous one is therefore safe.
Two identical transactions on the same day in the same statement (same date, label and amount) are kept as two separate ones, because two coffees at the same price on the same morning do happen. If your bank printed a line twice, remove it on the review screen.
Several statements at once: drop them together. They are reviewed one after the other, and each is compared with what the previous ones just saved, so two statements that overlap count nothing twice. A line already saved with the opposite sign, such as an older PDF import read the wrong way round, is flagged "Sign flipped?": check which one is right. And a statement, PDF or CSV, that prints its opening and closing balance is checked live: the screen says "Checked" when the lines add up to it to the cent, shows the gap otherwise, and redoes the sum at every correction. A line you remove yourself is not counted as a misreading. A statement that prints no balances is not checked, and the screen does not pretend otherwise.
Does a large one-off purchase skew my FIRE date?
Not if it is set apart. The FIRE date computed from the budget rests on the average of your last complete months: a notary payment or a car paid in cash would push it back by years, as if you bought it again every year.
When a spending weighs more than three months of your usual spending (3,000 € at least), the Budget asks whether it is exceptional. "Yes, exceptional" keeps it in its month's budget but takes it out of the average behind the FIRE date and the levers; "No, ordinary spending" lets it count, and the question is not asked again. Set-apart spending stays listed, with "Put back in the average".
What does the "What your assets paid you this month" card measure?
The share of the month's spending covered by what your assets pay you: your rents ("Rental income") and your capital income ("Investment income"), such as dividends or interest landing in your account. It is the measure that matters for financial independence: the day it passes 100%, your assets pay for your lifestyle.
An internal transfer or a withdrawal from savings does not count, it is not income. For a line to count, it has to be filed under one of those two categories.
How do I share one transaction between several categories?
In the Budget page's transactions table, the pencil on the line, then "Split": a 100 € receipt becomes, say, 80 € of "Food" and 20 € of "Home & maintenance". You enter every part but the last, which takes the rest: the parts always add up to the line exactly. A part can carry a note.
Your bank's line stays whole, with its label, date and amount: it is what the next import recognises as already there. Each part counts in its category everywhere: totals, targets, left to spend, savings rate, dashboard, monthly report and CSV export. "Back to one category" removes the parts. The amount of a split line can only be changed after that.
How do I export or delete my budget transactions?
"Export CSV", on the Budget page, downloads all your categorised transactions as a file that opens straight in Excel, on every plan: in English, commas between columns, a decimal point and year-month-day dates. A split transaction appears as one line per part. The statement import reads it back, so it can be taken into another IgniFI account. To delete, select rows in the transactions table and choose "Delete", or delete them one by one; "Clear all data" removes every imported transaction at once.
These deletions are permanent: export first whatever you want to keep.
Goals and reports
How do I create a goal?
From the Dashboard, "My goals" section, button "Add a goal". Pick a type (financial independence, retirement, real estate, rental income, starting a business, personal project, a child's birth, supporting a parent, a trip, a free-form goal or capital preservation), a target amount and, if you want, a date.
You do not have to be aiming for FIRE. Goals are plural and of different kinds, and both the tracking and the monthly report treat them all the same way.
Can I limit a goal to specific accounts?
Yes, and it is often essential. A house deposit built up in a savings account and a securities account must not be measured against your whole net worth, otherwise your retirement savings would make it look already funded.
When creating the goal, pick the accounts it covers. Its progress then counts only those.
What is the monthly email report?
An email sent on the 1st of each month, covering the month just ended: net worth and its change, progress on each of your goals, income and spending for the month with a breakdown by category and a comparison with the previous month.
It is included in IgniFI+ and Pro. On the 25th, a reminder goes out only if one of your accounts is past its update rhythm, and names it. You can turn the report off at any time under "Settings", in the Notifications section.
How is a goal's estimated date calculated?
From your current net worth, your saving effort and a return assumption. It is arithmetic, not a forecast: it moves whenever your figures move, and it guarantees nothing. Markets do not follow a straight line.
Why is IgniFI flagging a concentration?
Because one line makes up an unusually large share of your portfolio. It is a factual observation about the split, not a recommendation to sell: nothing in IgniFI tells you what to buy or sell.
Broad diversified ETFs (world, S&P 500, bonds) do not trigger it, since the diversification is already inside the product.
Can I run my simulations in a currency other than the euro?
Yes. The withdrawal plan has its own currency picker at the top of the page: everything it shows, including the amounts you type, follows that choice. The labels follow it too, so a dollar plan will never talk to you about euros.
Two exceptions, and they are facts rather than oversights. Amounts written into French law stay in euros: the PEA cap, the deposit guarantee, the life-insurance allowance. Converting them would state the law incorrectly. And our prices stay in euros because that is what we invoice.
Worth knowing: goals are held in euros, with no picker. If you live outside the euro area, enter their amounts converted.
What are the Stress Test and the Withdrawal plan for?
The Stress Test simulates scenarios (a crash, a large one-off expense, inflation) and shows the effect on your portfolio. The withdrawal plan turns a capital sum into a monthly income and estimates how long it lasts against inflation, returns and a crash early in retirement.
Both are simulations based on your own figures and on assumptions you choose. Neither is investment advice, and neither guarantees any outcome.
Can I redo the opening questionnaire?
Yes, from Settings, under "Help and guides", the "Redo the questionnaire" button. Your current answers are the starting point: change what has changed, leave the rest.
It updates your main goal rather than creating a second one, and your other goals are untouched.
What is FIRE, and do I have to aim for it?
FIRE stands for "Financial Independence, Retire Early": building enough wealth that its income covers your spending without depending on a salary. The 4% rule is the usual yardstick: capital of about 25 times your annual spending. Many people mostly want freedom of choice rather than to stop working.
You do not have to aim for it: IgniFI also tracks retirement, a property purchase, rental income, a project, preserving capital or a free-form goal. For a FIRE goal it computes the target and an estimated date, which are projections and not promises.
How is a financial-independence goal's target computed?
With the 4% rule: your planned monthly spending × 12 × 25, that is the capital of which 4% a year covers that spending. For a retirement goal, it is the desired income minus the estimated pension, × 12 × 25.
A loan that will be repaid before you are independent is not a lifelong expense: the "Of which loan repayments that will have ended" field takes those repayments out before the calculation, and the card says so. If your spending is the household's, the target is brought down to your share of the budget, the same level as your progress. The target can be changed at any time from the goal itself.
Which wealth are my goals measured against?
It depends on the goal. A financial-independence or retirement goal is measured on your investable wealth: everything you own except your main residence and its loan, net of your other loans, because nobody lives off selling their home. Mark your home with the "This is my main residence" box; without it, it is counted.
A goal can also follow "Specific accounts": only those accounts' value counts, for instance a savings account and a brokerage account for a deposit. With "No linked account" its progress stays at 0%. With no particular choice, a goal follows all your wealth.
I have a target date: how much should I put aside each month?
Choose "I have a target date" when creating the goal: IgniFI works out the monthly saving that reaches the amount on that date, from your current wealth and an assumption of 4% a year above inflation, shown as such. If your wealth is already enough, it says so. For a financial-independence or retirement goal the deadline is an age: choose "I have a target age", and the monthly saving is worked out up to the age you aim for, which your withdrawal plan also opens on unless you have saved a different age in it.
It is an assumption, not a forecast nor advice: the figure moves with your amounts, and markets do not follow a straight line. The other way round, "I know my monthly savings" gives the estimated date from what you put aside.
How do I see my goals' progress over time?
The "How your goals have moved" chart, in the dashboard's Goals tab, shows the share of each goal already reached, day after day, in percent so that goals of very different sizes compare on one scale. Two snapshots are needed to draw a line: on a new account it appears the next day.
The line breaks on days a goal cannot be measured, rather than joining two points across an unknown period. The "Savings Projection" in the same tab projects forward with sliders: monthly saving, return and horizon, in current euros or today's.
How do I share my recap without revealing my amounts?
With "My recap", on the dashboard: a card of the last twelve months showing percentages only (change in tracked wealth, savings rate, progress on the main goal, rank). "Download image" saves it, "Share" sends it from your phone, and "Copy the link" gives a link to paste as a caption: Instagram and Facebook do not accept an image sent from a website.
One amount can appear on it, and only if you tick "Show my milestone (one amount will appear)". The age entered for the INSEE comparison is kept on this device only.
How is my rank among French households computed?
Your gross wealth is compared with INSEE's household wealth survey, for households in your age bracket and family configuration (single person, single parent, couple with or without children), set in Settings under "Your household". As a couple, the household is what gets ranked: a property owned by both counts in full. Single, the rank is on your share.
The rank is computed on gross wealth, debts not deducted, and in euros, because that is how INSEE publishes. It covers only what you entered: an incomplete net worth gives too low a rank. Outside France it places you among French households, the only population INSEE surveys. It is an indicative estimate.
Subscription
What is the difference between the plans?
The free plan tracks 1 account and 1 goal, in the display currency of your choice, with 12 months of history and 2 AI PDF imports to try. It stays free, with no time limit.
IgniFI+ adds AI statement import (15 a month), full budget history and the monthly report, for 2 accounts and 2 goals. Pro removes every limit: unlimited accounts and goals, stress test, withdrawal plan, full history, and CSV export on the annual and multi-year plans.
How do I cancel my subscription?
From "Settings", Subscription section, in one click and with no questions asked. The subscription stays active until the end of the period already paid for, then your account reverts to free. Your data stays accessible.
Which payment methods do you accept?
Card payment, through Stripe. IgniFI never sees or stores your card number. Prices are shown and charged in euros, whichever country you pay from.
What exactly is the coaching?
A live conversation, screen shared, about your figures and your goals. The point is not to tell you what to buy, but to spare you common mistakes and to think through a way of managing your money that fits you.
It is not investment advice and it does not replace a licensed adviser.
How much do IgniFI+ and Pro cost?
The free plan costs nothing and has no time limit. IgniFI+ costs €2.99 a month, with no commitment. Pro costs €9.99 a month, or €99 for 12 months (€8.25 a month, 2 months free), €179 for 24 months (€7.46 a month, 6 months free), €239 for 36 months (€6.64 a month, 12 months free).
Prices are shown and charged in euros, by card through Stripe, and the subscription can be cancelled at any time. They are in the Pricing section of the home page, and you subscribe from Settings, button "See the plans". Coaching is billed separately.
What does each plan include, limit by limit?
Free: 1 account and 1 goal, 2 AI imports for life, 12 months of net worth history and the last 12 months of budget. IgniFI+: 2 accounts and 2 goals, 15 AI imports a month, 12 months of net worth history. Pro: unlimited accounts and unlimited goals, 20 AI imports a month.
From IgniFI+: more accounts and loans, the whole budget history, the monthly email report. Pro only: the Stress Test on your own accounts, the withdrawal plan, rebuilding your net worth history, the full net worth history and importing old statements. Loans follow the same limit as accounts. The portfolio CSV export comes with the annual and multi-year Pro plans.
On every plan: unlimited CSV and Excel imports, any display currency, the budget CSV export and a complete copy of your data as JSON. Technical ceilings, whatever the plan: 150 accounts, 1,000 holdings and 50 loans.
How do I upgrade, change plan or pause it?
From Settings, Subscription section. Without a subscription, "See the plans" presents IgniFI+ and Pro, with the choice of duration for Pro; you pay by card on a Stripe page. With a subscription, "Manage subscription" opens the Stripe portal: change plan, pause or cancel.
After a payment, activation can take a few seconds; if your plan does not show, reload the page: it is a Stripe delay, not a failed payment. A cancellation takes effect at the end of the paid period, with no pro-rata refund of the period started, and your data stays accessible on the free plan.
Simulators and tools
How does the Stress Test work?
The Stress Test puts your allocation through past crises: COVID-19 Crash, Crypto Winter 2022, 2022-2023 rate hikes, 2008 financial crisis, Dot-com bubble 2000 and 1970s stagflation. For each it gives the estimated loss, the value after the crisis and the breakdown by asset class; with loans, it shows the leverage effect on your net worth, since a debt does not fall during a crash. With a loan in a currency that floats against the euro, a card replays 15 January 2015, when the Swiss franc rose 16.8% against the euro in one day, on your debt, your instalments and what you hold in that currency.
The Monte Carlo simulation then draws hundreds of market paths from your allocation's returns and volatility, over the horizon and monthly saving you choose, and gives a pessimistic, median and optimistic range, also in today's euros. The main residence follows French home prices, and crypto a median path of 10% a year above inflation at 50% volatility.
Without an account it runs on a €100,000 example portfolio, as a trial: some of the crises, without the Monte Carlo simulation or the income tests; on your own accounts it is a Pro feature. These are simulations, not forecasts.
What does "What if your income stopped?" measure in the Stress Test?
What two shocks to your income take from your savings: several months without income, or an unexpected expense. Your monthly spending comes from your budget (the average of your complete months over the last twelve, at your share), otherwise from your FIRE goal, otherwise from what you type.
The safety cushion, your cash and savings accounts, pays first; then your investments are sold at today's value, with no tax or fees; the main residence is never sold. The screen states how many months your cushion covers, what is taken from investments, and the delay to your FIRE date, which counts both the saving not made and the capital spent.
What is the withdrawal plan for?
The withdrawal plan turns capital into income: how much you can spend each month, and up to what age it lasts against inflation, returns, tax and a crash. It starts from your goal ("Import from my objective") or from your accounts, wrapper by wrapper ("Import my accounts (advanced)"), or from values you type.
Three withdrawal strategies: a fixed amount in today's euros raised with inflation, the 4% rule on the starting capital, or a percentage of the remaining capital each year. A pension, with its starting age, reduces what is withdrawn, and the plan counts the years to fund alone before it. The verdict gives the share of scenarios that last to the chosen age.
It is a Pro feature, and a simulation built on assumptions you can see and change, never advice. Without an account the page is a preview: the capital, the ages, the monthly spend and the verdict, without the pockets, the tax, the events or the detail of the simulations.
Withdrawal plan: how do pockets, tax and withdrawal order work?
In advanced mode, each pocket (a PEA, a life-insurance policy, a flat, a property fund…) keeps its own value, expected return and tax treatment. Income pockets pay their rents each year, net of tax, which reduces what has to be withdrawn; a pocket ticked "Keep as a reserve (emergency fund, never drawn)" is never spent. A PER stays locked until your generation's legal age, and a PEA or life-insurance policy that is too recent is taxed as such until it matures.
The "Withdrawal optimizer" draws first on the pockets with the lowest real return. In simple mode, "Tax on withdrawals" applies a brokerage account's, a PEA's or a life-insurance policy's tax to the gain part of each withdrawal. The life-insurance allowance rises from €4,600 to €9,200 a year if you say in Settings that you are married or in a civil partnership. Property is not counted in the capital to spend, unless you add it because you plan to sell.
How does the withdrawal plan test a crash or a large expense?
With three tools. "Crash during retirement" places a market fall in the year of your choice after you stop, with its recovery time: a bad sequence early in retirement is a plan's first risk. For a crash on your portfolio as it stands today, use the Stress test. "Irregular expenses" add a car, works or a child's studies, once or at regular intervals, and the plan replays each event alone to say what it costs you in years of autonomy.
The "Monte Carlo simulation" draws hundreds of sequences of good and bad years and gives a success rate, with a pessimistic, median and optimistic path; the volatility can be the one measured on your holdings. "View the plan as a document" produces a printable version, to save as PDF, with every assumption.
What is the Anti-Fragile simulator?
A simulator showing what copying a real eToro portfolio would have given, from its daily returns since 2014: you choose a fixed amount or a percentage of your net worth and a start date, and the curve is compared with the MSCI World and the Livret A, gross or after tax, in nominal or real terms. Signed in, "Compare with my portfolio" sets it against your own history.
This portfolio is Yannis's, IgniFI's founder, and the "Join eToro via my referral link" button is an affiliate link, which eToro may pay for if you open an account there; the simulation itself earns nothing. It illustrates past performance, which does not predict future results, and is not a recommendation: copy trading carries a risk of capital loss.
How does the Property estimate work?
The Property estimate values a flat or a house from the actual notarised sales in the area (public DVF data): median price per m², interquartile range, number of comparable sales and the local trend. With a precise address it uses sales in the immediate neighbourhood. It also estimates a market rent and a gross yield, and prices parking, outdoor space, orientation and, for a house, the land separately.
Without an account, one estimate a day; with a free account, as many as you like, plus the refinements. When sales are too few, it says so instead of producing a figure. An estimate applies to a property in your accounts in one click, dated in its history, without rewriting your net worth's past.
How do I book a coaching session, and what does it cost?
From the Coaching page. The session lasts three hours by video, screen shared, on your figures: a preparation form a few days before, a written recap afterwards, a month of follow-up by email and three months of Pro included. It costs €499, billed separately from the subscription.
Direct booking in the calendar is open to Pro subscribers: you pay for the session by card through Stripe, then pick your slot. Otherwise "Contact us" lets you write to book or ask for a quote (longer support, couples, moving abroad…). Coaching is not investment advice: no product or investment is recommended in it.
Are there articles to understand financial concepts?
Yes. The Blog publishes in-depth articles, in French and English: financial independence and the 4% rule, wrappers and investment tax, retirement, inflation, deposit guarantees, median wealth by age, and how IgniFI computes some of its figures. The Glossary defines every term used in the app.
They are explanations so you can judge for yourself: neither the blog nor the glossary recommends an investment.
Where do I find what a financial term means (flat tax, TER…)?
In the Glossary, in the footer: every financial term used in the app is defined there, in French and English, grouped by theme (basics, FIRE, taxation, real estate, investments, risk, strategies, crypto). The assistant can also give you the definition.
Once the interactive lexicon is switched on, the same words are underlined on screen and their definition appears on hover or tap. A definition explains a word; it never says what to do with your money.
Who is behind IgniFI?
Yannis, French-Swiss, trained in economics and financial engineering in Lausanne, who spent seven years in commodities trading. He built IgniFI after years of tracking his investments in a spreadsheet, to start from accurate figures; the About page tells why. He also runs the coaching.
IgniFI lives on its subscriptions: no advertising, no data resale. The only paid link on the site is the eToro affiliate link in the Anti-Fragile simulator, labelled as such.
Data and security
Do you connect to my bank?
No, never. IgniFI connects to no bank and no broker, and will never ask for your banking credentials. You import your statements yourself, or type your amounts in by hand.
If a site claiming to be IgniFI ever asks for your banking credentials, it is not us.
Where is my data stored?
On servers located in the European Union, in a database where each user is isolated at the database engine level: technically, a query made for your account cannot reach another user's rows.
We sell no data and serve no advertising. The privacy policy sets out the details.
How do I turn on two-factor authentication?
From "Settings", Two-factor authentication section. You scan a code with an authenticator app (Google Authenticator, Authy, 1Password or another), and a six-digit code is then required after your password.
Ten recovery codes are handed to you right after you turn it on. They are shown once only: save them somewhere other than the phone that holds the app.
What are recovery codes for?
Each one replaces your authenticator app once. That is what stops you losing access to your account if you lose your phone.
They are shown once, when you turn two-factor authentication on, and we keep only a fingerprint of them: nobody at IgniFI can give them back to you. Save them in a password manager or on paper, somewhere other than the phone in question. You can generate a fresh set from "Settings": the previous one then stops working.
I lost my phone and two-factor authentication is on
On the verification screen, click "I lost my phone" and enter one of your recovery codes. You get straight in, and two-factor authentication is turned off on your account: switch it back on from "Settings" with your new phone.
If you have no codes left, check your password manager first: many sync the key across devices, in which case you can sign in from another one. As a last resort write to support@ignifi.io FROM YOUR ACCOUNT'S EMAIL ADDRESS: we send a confirmation link to that same address before switching anything off. We never switch it off on request alone.
Can I get my data back?
Yes, free and at any time. In Settings, "Download all my data (JSON)" produces a complete, machine-readable copy of everything we keep about you, whatever your plan and even after cancelling.
The Excel-compatible CSV exports of the portfolio ("Current positions" and "Net worth history") come with the annual and multi-year Pro plans. The budget CSV export is available on every plan from the Budget page.
These files open straight in Excel, in the language of the page: in English, with commas between columns, a decimal point and year-month-day dates; in French, with semicolons, a decimal comma and day/month/year dates.
How do I delete my account?
From "Settings", at the very bottom, in the red zone. Deletion is permanent and removes all of your data from our servers, with no copy retained. A confirmation email is sent to you.
Export whatever you want to keep beforehand. If a subscription is running, cancel it first.
Is this investment advice?
No. IgniFI is a tracking and visualisation tool. It recommends no investment, no product and no intermediary, takes no broker commission, and has no partner paying to be featured.
Investment decisions remain yours, and past performance does not predict future results. For a personal recommendation, speak to a licensed adviser.
Can I track a joint account or my partner's wealth?
An IgniFI account belongs to one person: there is no shared access between two users. Nothing stops you from entering a household's whole wealth on a single account, or from each having your own.
For a jointly held loan you can record your share, so that only that share weighs on your net worth. The "single" or "couple" setting is only used for the comparison against household wealth statistics.
I do not live in France. Can I use IgniFI?
Yes. Net worth tracking, budgeting and goals do not depend on any country. You can set your tax residency under "Settings": it adjusts the default currency and the tax treatment shown.
Some wrappers (French PEA, PER, livret A) are France-specific. If your residency is not French they are no longer offered at all: the wrapper picker shows only what you can actually open.
Nothing is lost by it. A "show all" button brings the full list back, and a wrapper you already hold is never hidden: an expat who kept their PEA still sees it and can still edit it.
How do I change my password or my email address?
The password is changed through the "Forgot your password?" link on the sign-in screen, even if you know the current one: the Forgot your password page sends an email, and its link opens the New password page. That link expires after an hour and works once; if it has expired, ask for another. The new password must differ from the old one.
There is no field to change your email address in Settings: to change it, write to us from the account's current address and give the new one.
Where are the terms of service and the privacy policy?
At the foot of every page: "Legal notice", "Terms of Service" and "Privacy policy". The terms describe the use of the service and the subscriptions, including cancellation and the right of withdrawal; the privacy policy describes the data collected, how long it is kept, the processors and your rights, including access, portability and erasure.
You accept the terms and the policy when you create your account.
Who else can see my data?
Nobody buys it and no advertising is shown. A few technical providers are involved, each for one task: Supabase stores your data and handles sign-in; Vercel hosts the app; Resend delivers the emails, including the monthly report, which contains your amounts; Stripe processes payments; Cloudflare checks you are not a robot at sign-up and sign-in. The only cookies are the session's.
Google (Gemini) receives a document only when you start an AI import yourself, and IgniFI does not keep it after extraction. Questions asked to the assistant are sent to it too, without any data from your accounts. Prices and exchange rates are fetched with no personal data. The full list is in the privacy policy.
Can my account be deleted if I stop using it?
Yes, under the privacy policy: an account with no paid subscription, no sign-in and no change for 36 months is deleted with its data. 3 warnings are sent to the account's address first, and simply signing in keeps everything.
Cancelling a subscription deletes nothing: the account returns to free with all its data.
Something looks wrong
I am not receiving IgniFI emails
Check your junk folder first, especially on Outlook and Hotmail. Mark the message as legitimate and add support@ignifi.io to your contacts: later emails will then arrive normally.
If nothing arrives after a few minutes, check the address recorded on your account, then write to us from another one.
I forgot my password
Use the reset link on the sign-in screen. You will receive an email valid for one hour. If it does not arrive, see the question about missing emails.
My total net worth does not match my statements
Three causes cover nearly every case. An account imported twice, a wrong quantity after a stock split, or a value in a foreign currency compared against a statement in euros.
Compare account by account rather than on the total: the discrepancy is almost always on a single line. The "Refresh" button on the Dashboard reloads prices and exchange rates.
My recap shows no growth figure. Why?
Because no honest percentage can be computed, and IgniFI would rather say nothing than say anything.
Growth is measured against a starting point. Three situations make it impossible: you have just started and there is only one snapshot, your starting point was near zero (dividing by almost nothing produces an eighteen-digit percentage), or the result exceeds a thousand per cent, at which point the sentence stops informing.
The card then falls back on your savings rate, which is still measurable. Growth comes back on its own once you have two separate snapshots with a real starting point, which takes a few weeks on a new account.
IgniFI is flagging an abnormal change
This is a deliberate safeguard: past certain thresholds, a change is flagged because it almost always comes from data entry rather than from the market. Net worth doubling in a month is usually an account entered twice or a mistyped quantity.
The warning changes nothing in your data, it simply invites you to check before believing the number.
Why is the chart green or red?
It is green when the selected period ends above where it started, red otherwise. Changing the period can therefore change the colour without anything in your data having moved.
Why does my chart start on that date?
Because it starts on the first day every one of your holdings is known, and not before.
The missing part is not reconstructed. Today's quantities could be applied to every past close, or a savings account run backwards at an assumed 2% a year, but the percentage printed in bold above the chart is computed from the first point of the curve: if that first point were invented, the most visible figure on the screen would be too, and no caption under a drawing catches up with a number already read.
So a share bought this morning is not drawn as held since 2020, and a savings balance entered on Tuesday does not climb gently from last year.
To reach further back, give us something to reach with: a purchase date on a position, a recorded movement, or a dated value on a savings account or a property. Each one lengthens the curve to the date it attests. The chart names the holdings that have nothing but the day their account was entered, since those are the ones setting the start.
What exactly is the MSCI World line compared against?
Against your listed positions only, and the money you put into them.
Not against your total net worth. On a portfolio that is two thirds property and savings accounts, that would amount to asserting a flat should have behaved like global equities, and most of the gap on screen would come from exactly that. The question an index comparison can answer is "am I doing better than the index on what I put into the market", so it covers that part alone.
It appears only when your contributions are known, from recorded movements or from the cost prices and purchase dates you entered. Without them the line would assume a single sum invested on day one, which is nobody's actual story, and the "same payments" caption would be false.
It ignores dealing fees and tax, and says so. It is a reference, not a promise.
My chart does not go back far enough
Two possible reasons. The free plan shows 12 months of history, Pro shows everything. And above all, a chart can only go back as far as your data: with no trade history entered or imported, the curve starts on the day you created your account.
What is the assistant at the bottom of the screen?
An automated assistant that answers questions about how IgniFI works, from this help centre and from nothing else. It cannot see your accounts, your holdings or your amounts, so it cannot tell you how much you spent in June, and it gives no investment advice.
When it does not know, it says so and offers to put you in touch with us rather than inventing an answer. Your questions tell us which articles are missing here.
My question is not here
Write to support@ignifi.io describing what you did, what you expected and what you got. A screenshot helps a lot. Never send us a password: we never need one.
On a phone, how do I see a word's definition?
A single tap on the underlined word opens its definition in a bubble, no long press needed. A second tap on the word closes it.
I switched the lexicon on and nothing is underlined
The lexicon only underlines words it knows, and only where they appear. A screen with no technical vocabulary is unchanged, which is expected.
To see it working, go to the dashboard (fund analysis, dividends, performance), to Budget (savings rate, cash flow) or to My accounts and your loans. If you still see nothing there, reload: the setting is remembered per browser, and a tab opened before you switched it on does not know about it.
I cannot sign in, what should I check?
Four causes come up. The account was just created and the confirmation link has not been opened: signing in is refused until it is. The email or password is wrong: "Forgot your password?" sends a link to choose a new one. Too many attempts in a row: wait a minute. The anti-bot check did not complete: wait for it to finish, or reload the page.
If two-factor authentication is on, the "Two-factor verification" screen then asks for the six-digit code from your app. Lost phone: "I lost my phone" lets you in with a recovery code. The Log in page is the starting point of all of this.
The assistant stopped answering or says I reached a limit
To stay fast and free, the assistant limits the number of questions: a few a minute, and a daily ceiling. Past that, try again a little later. When it cannot answer itself, including when the AI service is briefly unavailable, it offers the help articles closest to your question.
If no article answers, "Pass this to a person on the team" sends us the whole conversation, and a person on the team replies to your account's address. The assistant never sees your accounts: for a question about your figures, describe what you see on screen.
"Your data could not be loaded": have my accounts disappeared?
No. This message means reading failed, not that your net worth is empty: your accounts and holdings are intact. IgniFI shows this screen rather than a dashboard at zero, which would be lying.
Click "Retry"; it is almost always a passing network glitch. If it happens again, reload the page, then write to us with the time and the screen concerned.
A change was not saved, what should I do?
When a message says a change could not be saved, the screen goes back to what is really saved: nothing was changed halfway. Try again; the cause is usually an interrupted connection or an expired session, in which case sign in again.
Two refusals have their own message: a text that is too long (the name of an account, a holding, a loan or a goal is limited to 120 characters), and a limit reached, your plan's or the maximum number of entries in a section; the message says which.
Why is a holding "awaiting a price"?
Because IgniFI does not have any price for that security yet. Until it does, the line is not counted in your total, and the dashboard says so rather than showing it at zero or at an invented price.
It is normal right after adding a security: its price and history arrive with the evening update, or after "Refresh". If it lasts, the security may be misidentified: search for it by name and check its exchange, or track it by value in an "Other" account.
What do "Rates unavailable" and "not converted" mean?
That a currency could not be converted at today's rate. "Rates unavailable": today's rates could not be loaded, and IgniFI uses dated fallback rates, shown next to the total, which is then approximate; "Retry" reloads the rates. "not converted": no rate exists for that currency right now, and its amounts are counted as they are, unconverted.
Either way, the screen says so instead of presenting a total that would look exact.
Still stuck?
Write to us describing what you did, what you expected and what you got: a person on the team reads it and replies. A screenshot helps a lot. Never send us a password.
support@ignifi.ioUnsure about a financial term? See the glossary.